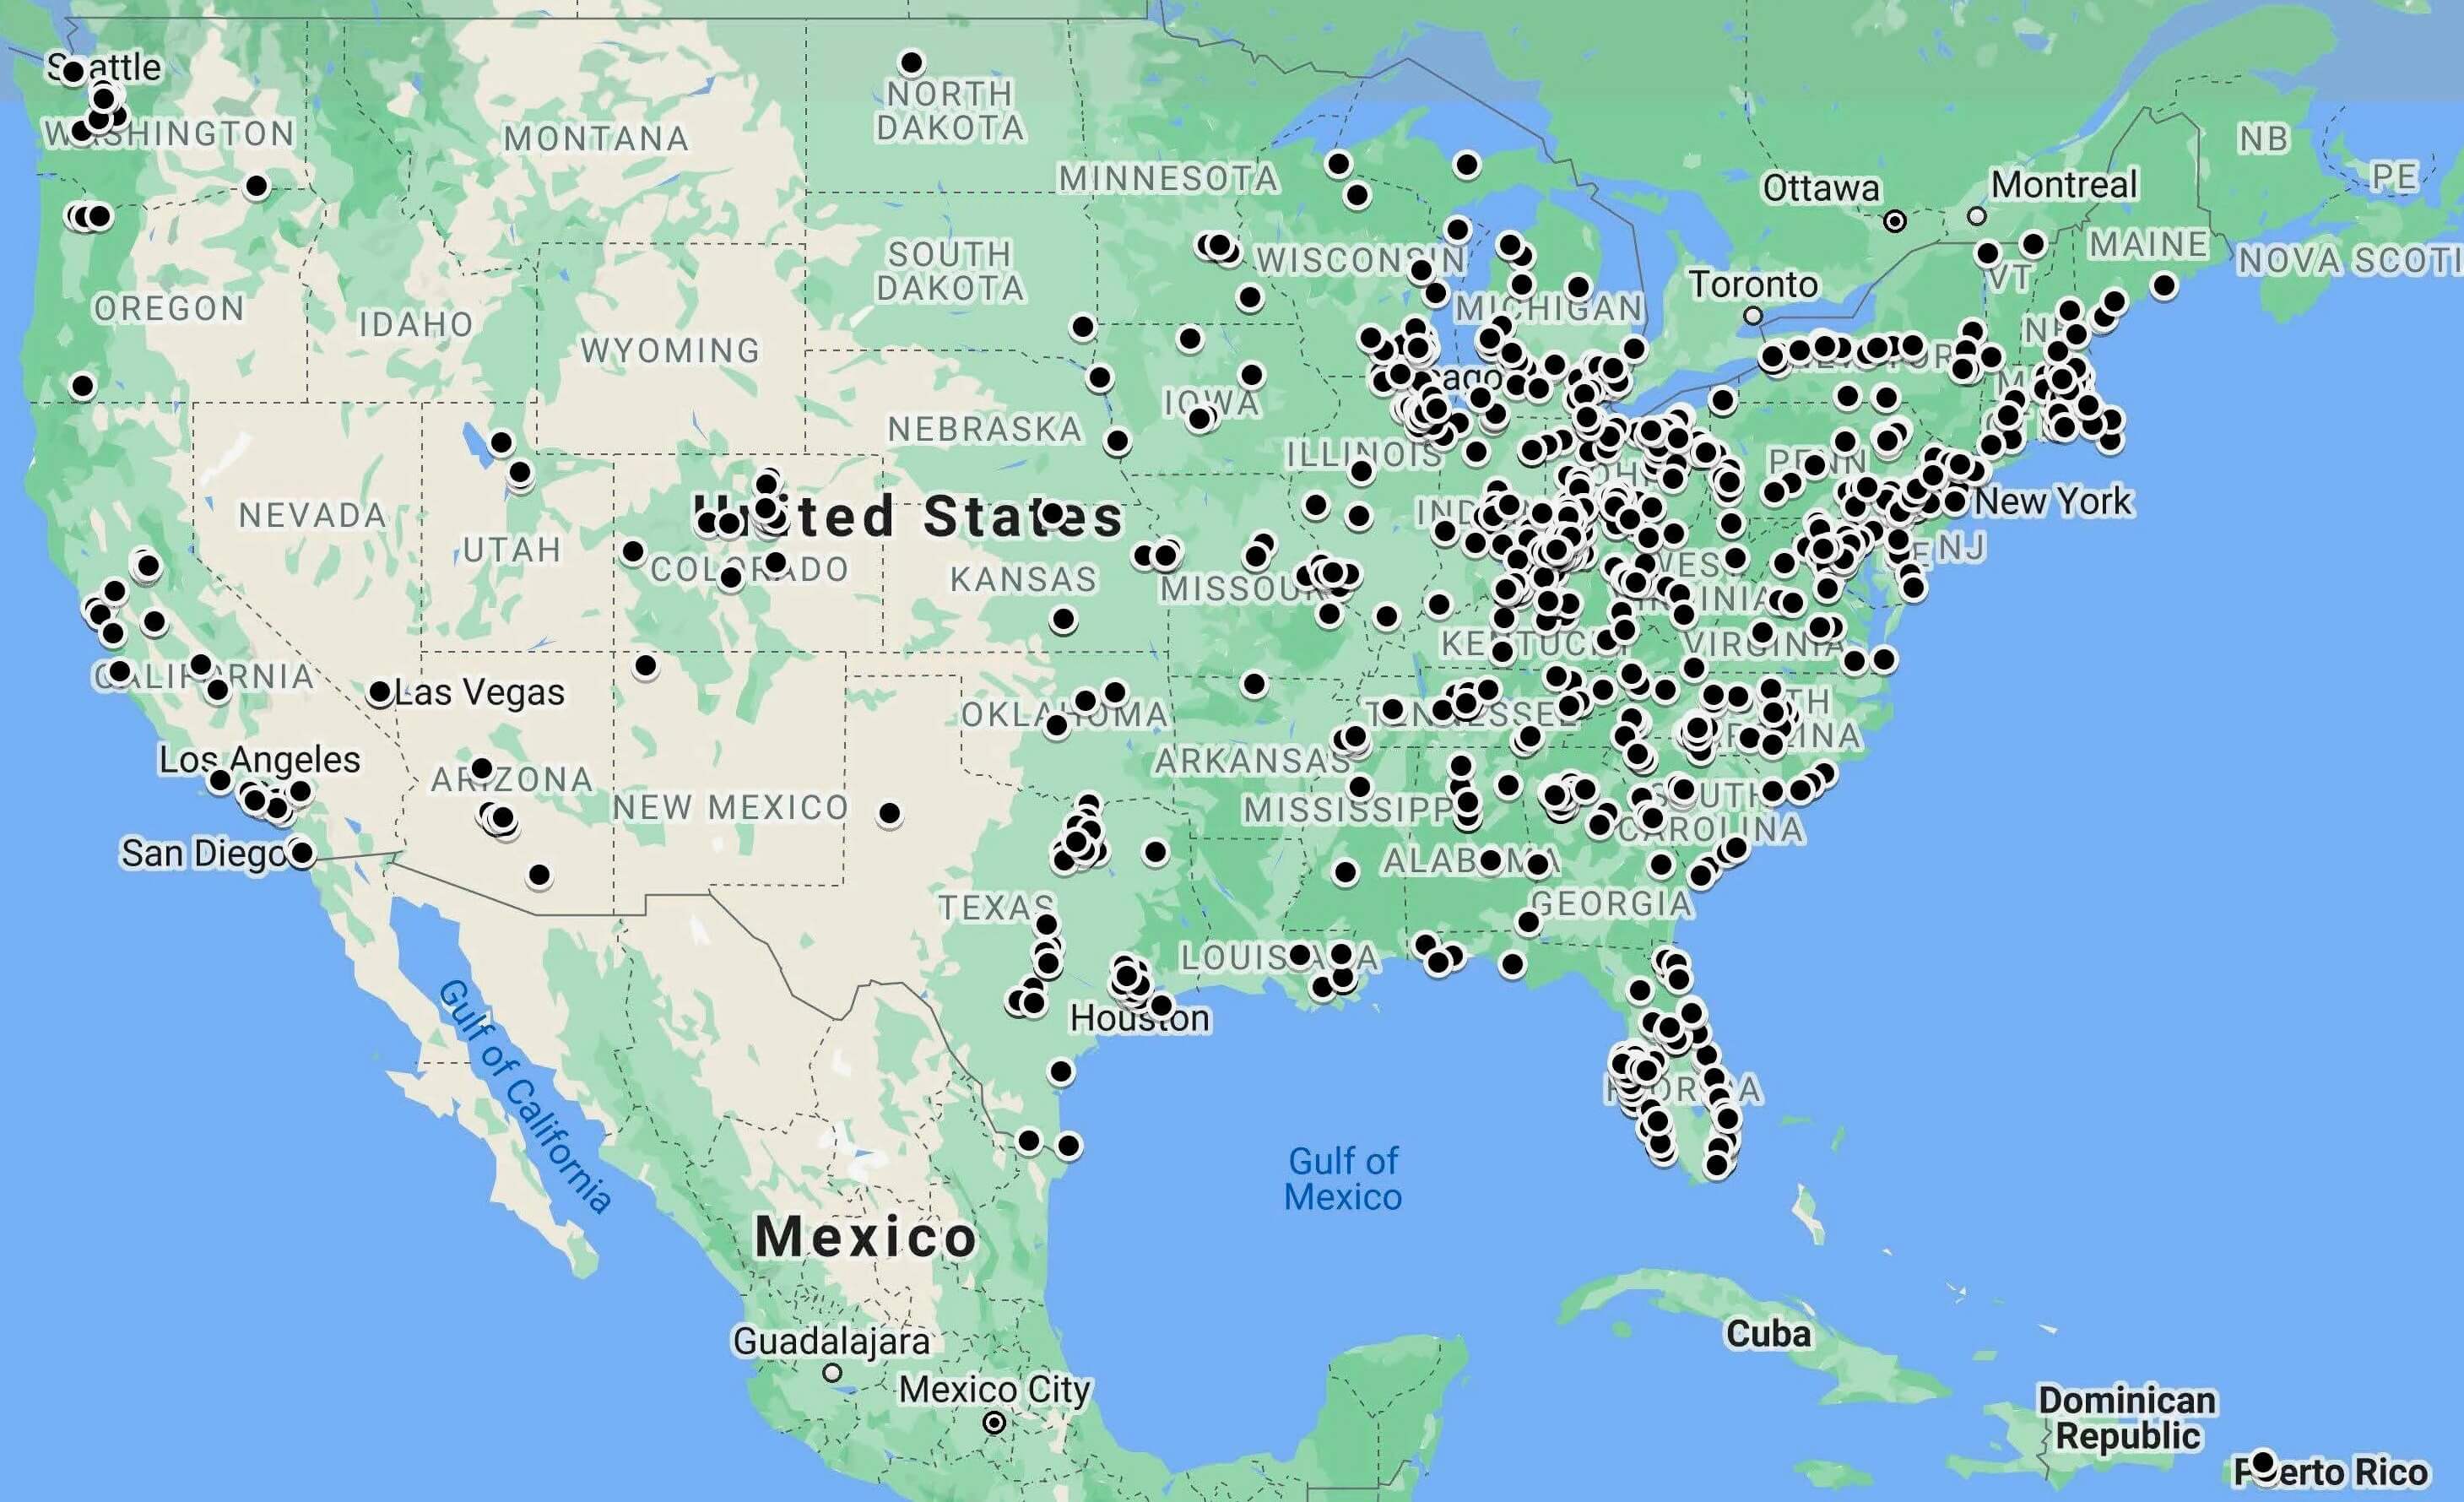
Where Are Our Graduates?
| Employment/ Employment Setting (Immediately after graduation) |
Number of Graduates in 2025 | Number of Graduates in 2024 | Number of Graduates in 2023 |
|---|---|---|---|
| Total Graduates Placed | 29 | 43 | 26 |
| Students Not Placed | 0 | 1 | 3 |
| Total Graduates | 29 | 44 | 29 |
| Post-Graduate Fellowship | 9 | 8 | 6 |
| Hospital/Health System | 15 | 16 | 15 |
| Physician Practice | 2 | 7 | 2 |
| Military Health System or VA | 0 | 0 | 0 |
| Governmental Agency | 0 | 0 | 0 |
| Trade Association | 0 | 0 | 0 |
| Foundation or Voluntary Agency | 0 | 0 | 0 |
| Long-term Care Facility | 1 | 1 | 2 |
| Home-health Agency | 0 | 0 | 0 |
| Consulting | 0 | 2 | 1 |
| Insurance/HMO | 0 | 1 | 0 |
| Information Technologies/Analytics | 0 | 0 | 0 |
| Pharmaceutical/Biotech/Medical Device Company | 1 | 2 | 0 |
| National Health Organizations | 0 | 1 | 0 |
| Investment Banking re: Healthcare | 0 | 0 | 0 |
| Venture Capital or Private Equity | 0 | 0 | 0 |
| Public Health | 0 | 2 | 0 |
| Teaching in Higher Education | 0 | 1 | 0 |
| Palliative Care/Hospice | 0 | 2 | 0 |
| Employed outside healthcare | 1 | 0 | 0 |
| Employed overseas in HC | 0 | 0 | 0 |
| Other | 0 | 0 | 0 |
| Current Positions by Type | Number of Graduates (2010-2025) |
|---|---|
| Executive Office (e.g. CEO, President, Chief Medical Officer, Chief Information Officer, Chief Operating Officer, Executive Director, Partner, Owner, etc.) | 37 (7.6%) |
| Other Executive Management (e.g. Vice President, Senior Vice President, Executive Vice President, Associate Vice President, Other Executive Management, etc.) | 53 (10.9%) |
| Management (e.g. Director, Manager, Unit Administrator, Practice Manager, etc.) | 201 (41.4%) |
| Administrative Staff (e.g. Senior Analyst, Senior Consultant, Financial Officer, Information Officer, Analyst, Consultant, etc.) | 118 (24.3%) |
| Clinical Staff (e.g. Registered Nurse, Pharmacist, Physical Therapist, Radiology Technician, etc.) | 13 (2.7%) |
| Physician | 1 (0.2%) |
| Educator/Faculty Member | 3 (0.6%) |
| Fellow/Intern | 9 (1.9%) |
| Other | 5 (1.0%) |
| Not Working | 7 (1.4%) |
| Unknown | 39 (8.0%) |
| Total Graduates | 486 (100%) |
Completion Rates for Recent Years*
| Full-Time Students | % Graduated |
|---|---|
| Class of 2025 (entered in 2022) | 100% |
| Class of 2024 (entered in 2021) | 100% |
| Executive MHSA Students | % Graduated |
|---|---|
| Class of 2021 (entered in 2018) | 100% |
| Class of 2020 (entered in 2017) | 100%** |
*Typical completion of the MHSA program is 3 years, however, all students are allotted 6 years from matriculation to complete the degree. Completion rates listed in the above chart are based on the number of full-time students who graduated from the MHSA program within 3 years of matriculation and the number of Executive MHSA students who completed the degree within 6 years of matriculation.
**One Executive MHSA student graduated in 4 years instead of 3 years
Retention Rates for Recent Years
(from first to second semester of program)
| Full-Time Students | Retention Rate |
|---|---|
| Class of 2025 (entered in 2022) | 100% |
| Class of 2024 (entered in 2021) | 100% |
| Executive Students | Retention Rate |
|---|---|
| Class of 2024 (entered in 2021) | 93% |
| Class of 2023 (entered in 2020) | 100% |
MHSA Alumni Map
(1960-2021)

Current Outcomes Data
MHSA (residential) - Explore the MHSA (Residential) Program Accreditation Details
Executive MHSA (online) - Learn More About the Executive MHSA (Online) Program Accreditation